Miscellaneous
Projects | | Links:
A collection of Javascript/WebGL tests
[R/Plotly] 3D Waves point distribution and animation
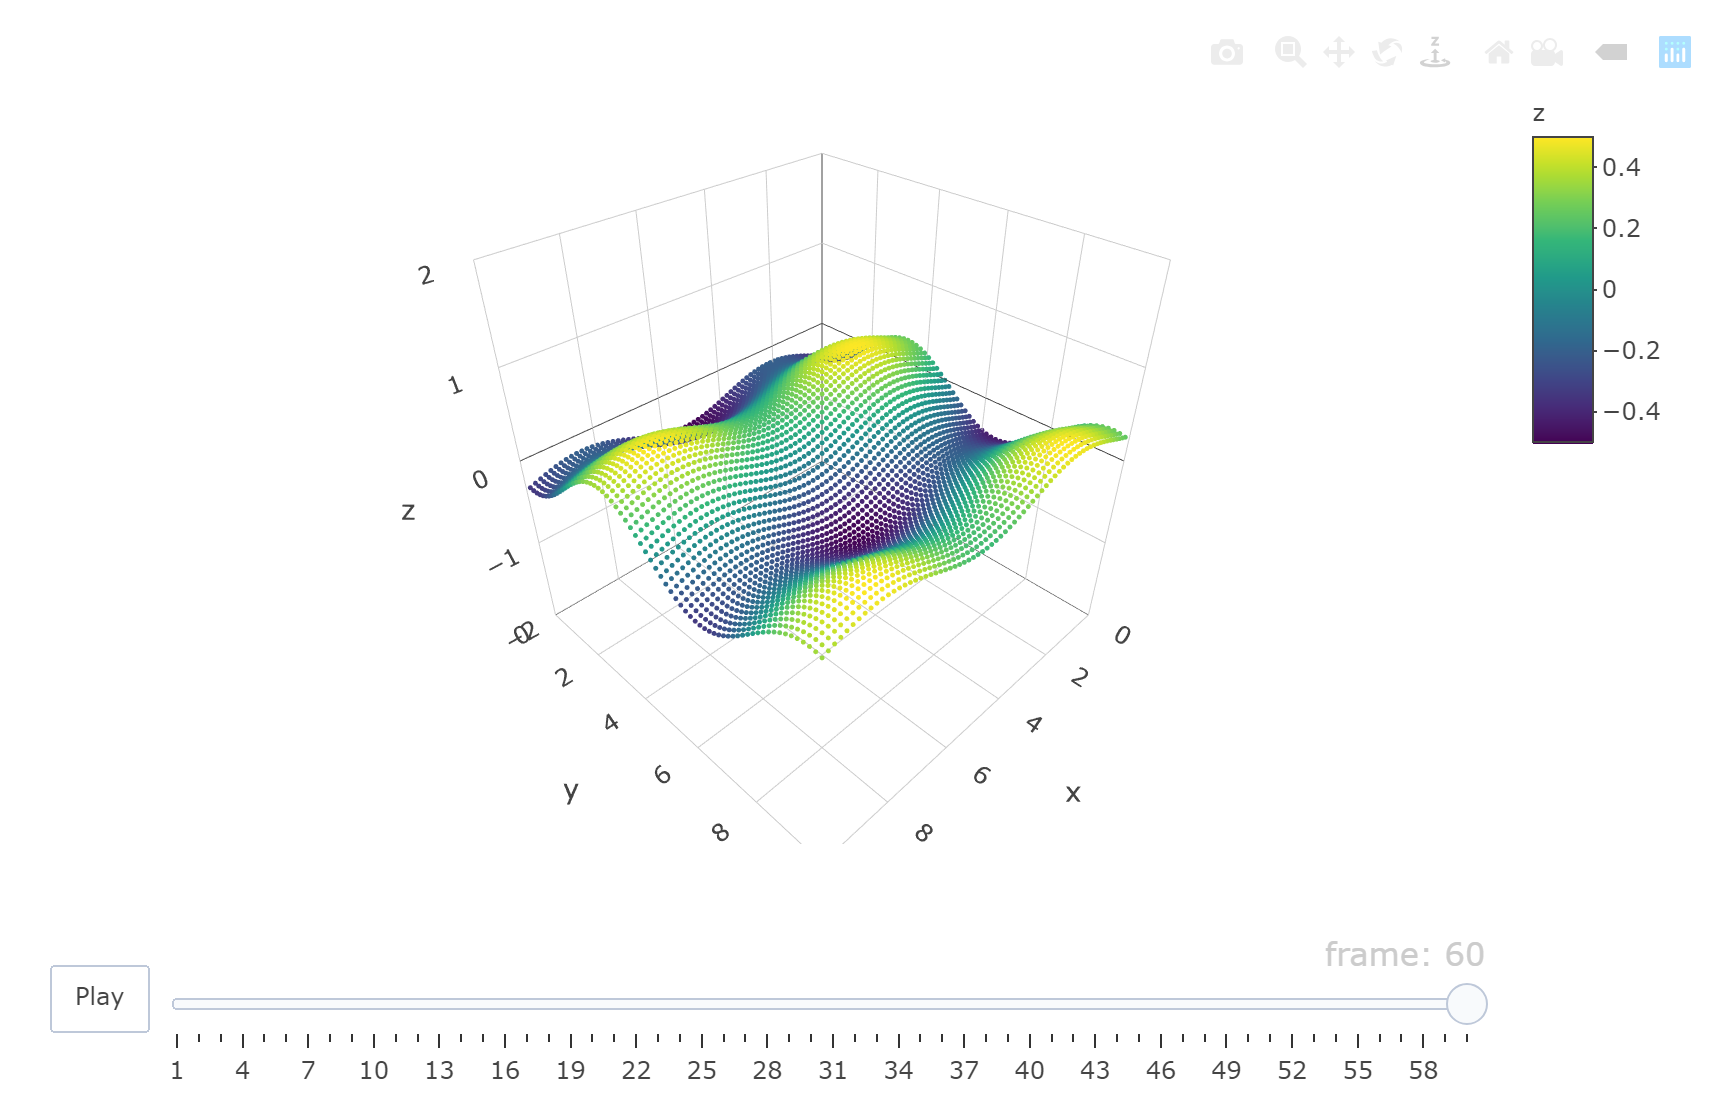
This is a little fun test I have tried some time ago. I wanted to test the animations with Plotly and R and what best way to test it if not some nice smooth waves? No crazy math, just a mix of sin() and cos()library(plotly)
spacing <- 0.15
sideLength <- 10
fps <- 30
seconds <- 2
frames <- fps*seconds
pointRow <- seq(0,sideLength, spacing)
nPoints <- length(pointRow)
x <- rep(pointRow,nPoints)
y <- sort(rep(pointRow, nPoints))
frame <- sort(rep(seq(1,frames), nPoints*nPoints))
x <- rep(x, frames)
y <- rep(y, frames)
z <- matrix(0, nrow = nPoints, ncol = nPoints)
data <- data.frame("x"=as.numeric(x), "y"=as.numeric(y), "frame"=as.numeric(frame))
data$z <- sin(data$x+data$frame*0.2)*0.15 + cos(data$y +data$frame*0.05)*0.35
yRange <- c(min(data$z), max(data$z))
data$alpha <- data$y
data$color <- data$y + yRange[1]
p <- plot_ly(data, x = ~x, y = ~y, z = ~z, color = ~z, opacity = ~z, frame=~frame, marker = list(size = 1.4)) %>%
add_markers() %>%
layout(scene =
list(
xaxis = list(range = c(0,gridSize)),
yaxis = list(range = c(0,gridSize)),
zaxis = list(range = c(-2,2)))) %>%
animation_opts(1000/fps)
p
htmlwidgets::saveWidget(as_widget(p), file = "/assets/gabryxx7/plots/wave.html", selfcontained = TRUE)
[JS/Plotly] Plotly animation and 3D data visualisation
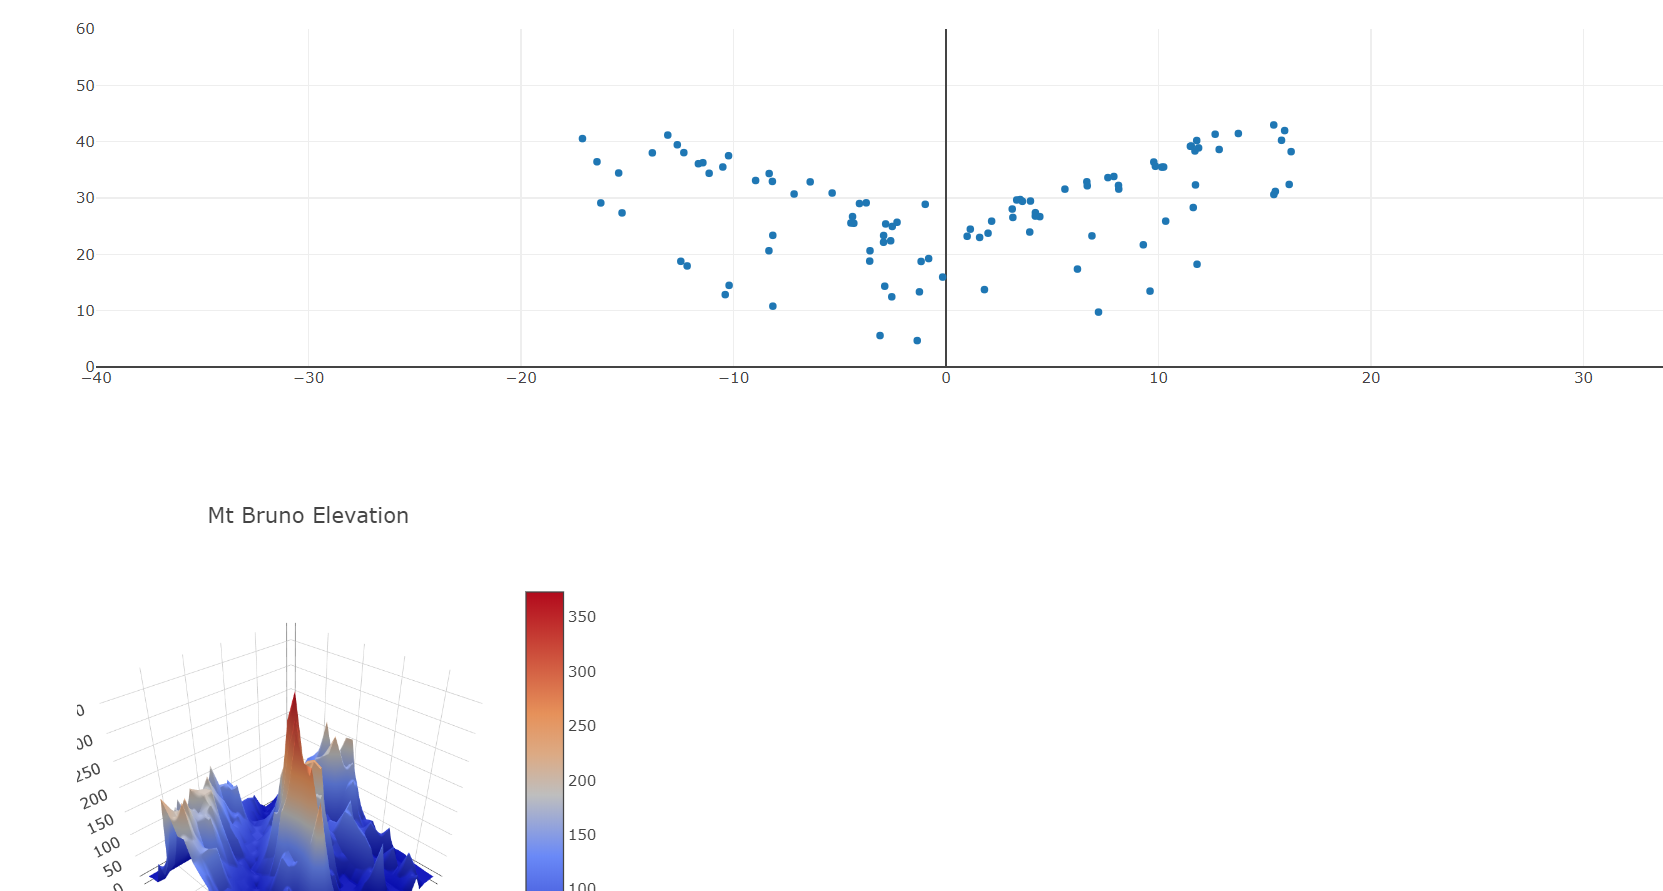
Similar to the wave test I wanted to tr Plotly with javascript so I tested a few animations and 3D graphs
[WebGL] Cubes recursion generator
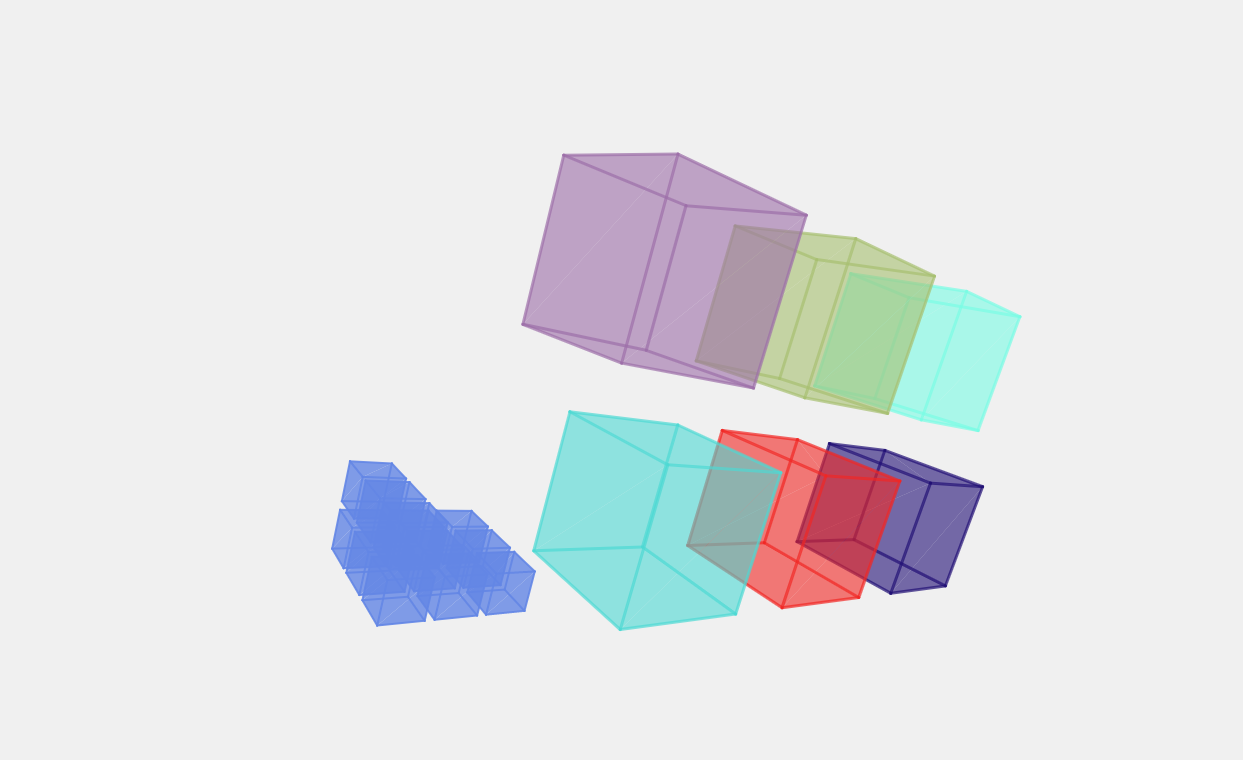
While working at the European Central Bank there was a lot of talking about “cubes” of data, three dimensional models of datasets. I like to see it as a bunch of stacked Excel spreadsheet. The spreasheets are 2-dimensional so stacking them would make it 3-dimensional and can be seen as a cube instead of a rectangle. So I decided to try my hand at the generation of recursive cubes, with smaller and smaller ones inside each cube.
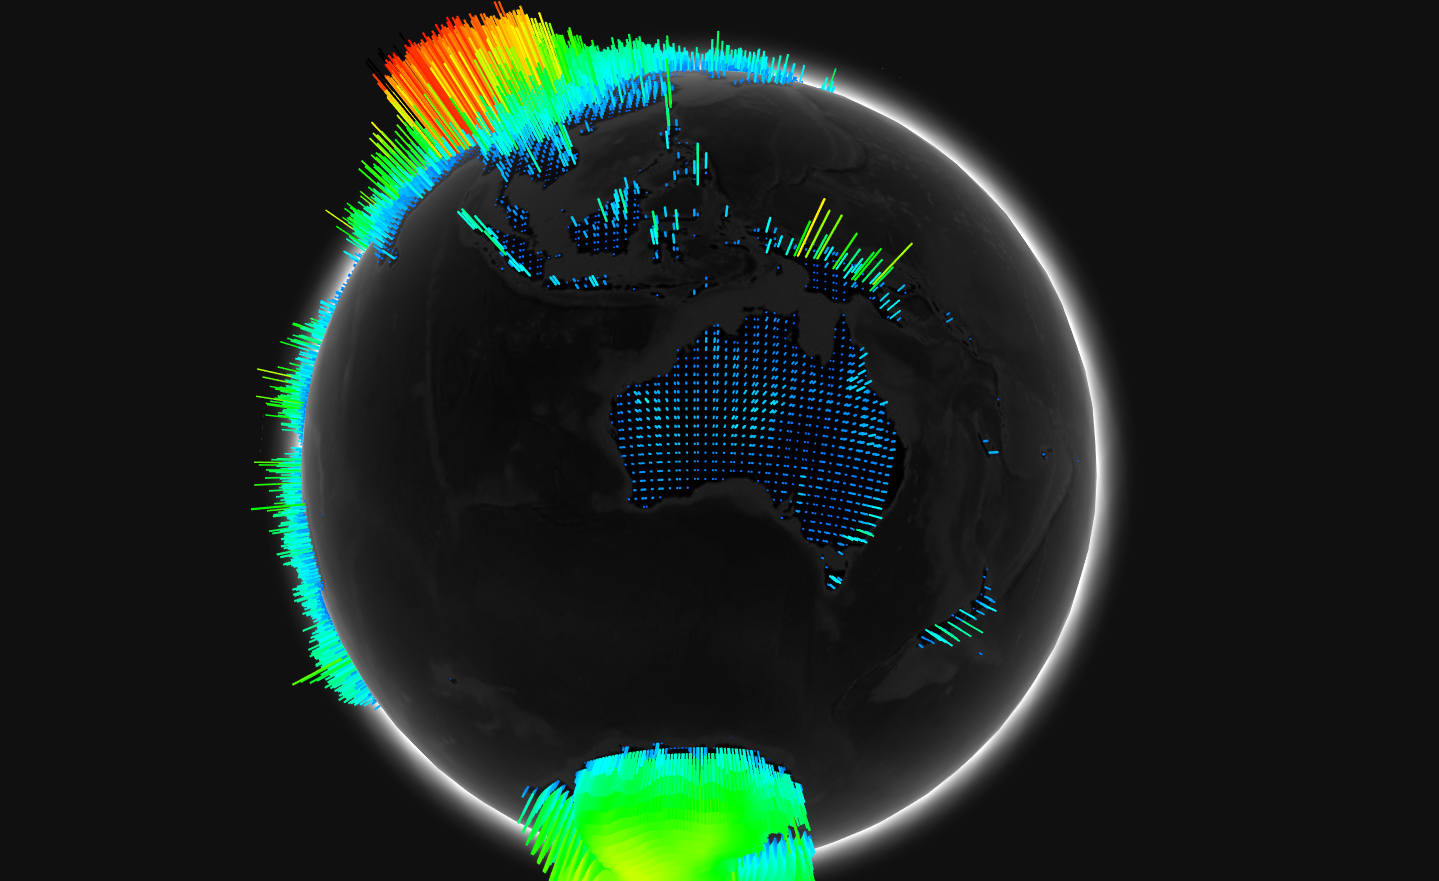
[WebGL] Globe Data Visualisation
A little fun test on global geographical data visualisation with WebGL.
[JS] Canvas JSON marker rendering
A pure javascript implementation of a map with fixed point as markers.