R Markdown
Alright so I am finally doing it! I am describing how I make Gantt charts in R, and how I want to make it easier to generate them through shiny dashboards. This is an R Markdown document. Markdown is a simple formatting syntax for authoring HTML, PDF, and MS Word documents. For more details on using R Markdown see http://rmarkdown.rstudio.com.
When you click the Knit button a document will be generated that includes both content as well as the output of any embedded R code chunks within the document. You can embed an R code chunk like this:
library(tidyverse)
vlines <- tribble(
  ~Date, ~LineType, ~Size, ~Color,
  "2020-01-01", "solid", 0.6, "grey80",
  "2021-01-01", "solid", 0.6, "grey80")
summary(cars)
##      speed           dist
##  Min.   : 4.0   Min.   :  2.00
##  1st Qu.:12.0   1st Qu.: 26.00
##  Median :15.0   Median : 36.00
##  Mean   :15.4   Mean   : 42.98
##  3rd Qu.:19.0   3rd Qu.: 56.00
##  Max.   :25.0   Max.   :120.00
Title 2
So Imma going to try to add a few extra lines and see what the output is going to be
summary(mtcars)
##       mpg             cyl             disp             hp
##  Min.   :10.40   Min.   :4.000   Min.   : 71.1   Min.   : 52.0
##  1st Qu.:15.43   1st Qu.:4.000   1st Qu.:120.8   1st Qu.: 96.5
##  Median :19.20   Median :6.000   Median :196.3   Median :123.0
##  Mean   :20.09   Mean   :6.188   Mean   :230.7   Mean   :146.7
##  3rd Qu.:22.80   3rd Qu.:8.000   3rd Qu.:326.0   3rd Qu.:180.0
##  Max.   :33.90   Max.   :8.000   Max.   :472.0   Max.   :335.0
##       drat             wt             qsec             vs
##  Min.   :2.760   Min.   :1.513   Min.   :14.50   Min.   :0.0000
##  1st Qu.:3.080   1st Qu.:2.581   1st Qu.:16.89   1st Qu.:0.0000
##  Median :3.695   Median :3.325   Median :17.71   Median :0.0000
##  Mean   :3.597   Mean   :3.217   Mean   :17.85   Mean   :0.4375
##  3rd Qu.:3.920   3rd Qu.:3.610   3rd Qu.:18.90   3rd Qu.:1.0000
##  Max.   :4.930   Max.   :5.424   Max.   :22.90   Max.   :1.0000
##        am              gear            carb
##  Min.   :0.0000   Min.   :3.000   Min.   :1.000
##  1st Qu.:0.0000   1st Qu.:3.000   1st Qu.:2.000
##  Median :0.0000   Median :4.000   Median :2.000
##  Mean   :0.4062   Mean   :3.688   Mean   :2.812
##  3rd Qu.:1.0000   3rd Qu.:4.000   3rd Qu.:4.000
##  Max.   :1.0000   Max.   :5.000   Max.   :8.000
Including Plots
You can also embed plots, for example:
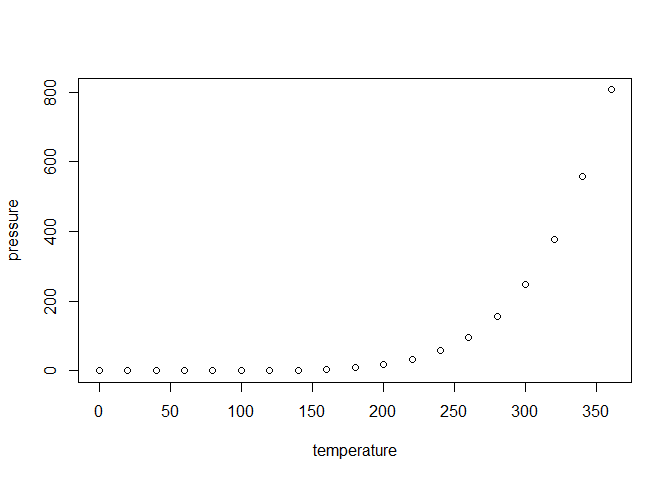
Note that the echo = FALSE parameter was added to the code chunk to prevent printing of the R code that generated the plot.